
Observability & Studio
Enable Wolbarg telemetry and explore it in Wolbarg Studio — live dashboard, Trace Explorer waterfalls, and ops surfaces.
Overview
Wolbarg records what your agents' memory is doing into an independent telemetry database — never the same tables as your memory store. Explore that data with Wolbarg Studio, a local read-only dashboard for operations, traces, recalls, and checkpoints.
Enabling telemetry
import { wolbarg, sqlite, openaiEmbedding } from "wolbarg";

const ctx = wolbarg({
  organization: "my-org",
  storage: sqlite("./memory.db"),
  embedding: openaiEmbedding({
    apiKey: process.env.OPENAI_API_KEY!,
    model: "text-embedding-3-small",
  }),
  telemetry: {
    enabled: true,
    database: { provider: "sqlite", url: "./telemetry.db" },
    level: "debug", // off | error | warn | info | debug | trace
    captureQueries: false, // default since 0.6.0 — set true to persist query strings
    captureLatency: true,
    captureErrors: true,
    captureSimilarity: true,
  },
});
Every operation (remember, recall, ingest, compress, checkpoint, rollback, rememberBatch, recallBatch, …) emits an event with:
session_id,trace_id,parent_trace_id— for waterfall tracesorganization,agent,tags,checkpoint_id- measured stage spans (embedding, vector search, ranking, database read/write)
- persisted recall explanations when
explain: true
Call await ctx.flushTelemetry() before exiting short-lived scripts to ensure the async emitter drains.
Telemetry is SQLite-only today (the interface is ready for Postgres). It is fully independent of your memory backend, so you can use Postgres for memory and SQLite for telemetry. Keep telemetry on a separate file from memory storage.
Recall explain mode
const explained = await ctx.recall({ query: "recurring invoices", explain: true });

for (const hit of explained.results) {
  console.log(hit.memory.id, hit.score, hit.rankingReason);
}
console.log(explained.searchTime, explained.rankingTime, explained.traceId);
Schema versioning
Telemetry SQLite files use an additive, versioned schema. On writable open, v1 files are migrated in place to v2 and keep all existing events. V2 adds organization, agent, tags, checkpoint, persisted recall explanations, and stage spans. Read-only access to an unmigrated v1 file remains supported.
SqliteEventDatabase.query() can filter by organization, agentId, tag, and checkpointId.
Wolbarg Studio
Studio is a standalone dashboard (Next.js) — not bundled into the SDK. The SDK writes events; Studio reads them (and can also open memory files for hydration).
git clone https://github.com/Atharvmunde11/wolbarg-studio
cd wolbarg-studio
npm install
npm run dev   # http://localhost:3100
On first launch, use Connect / Settings to point at:
- Telemetry database (e.g.
./telemetry.db) - Memory database (optional — for counts / hydration)
- Checkpoint directory (optional)
Connections persist in your user config directory (~/.wolbarg/studio.json or the AppData equivalent), never inside the project.
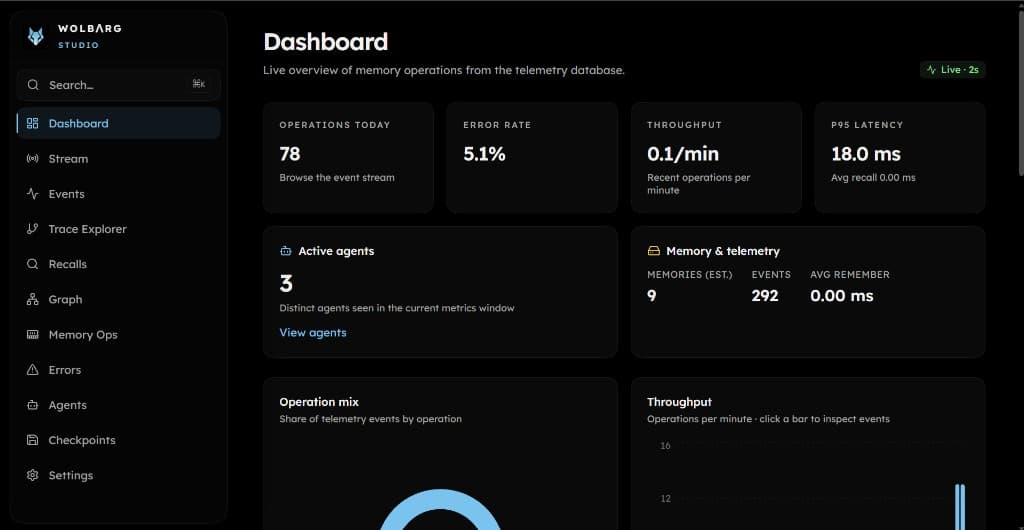
Dashboard
Live overview of memory operations from the telemetry database — operations today, error rate, throughput, P95 latency, active agents, and charts. (See the screenshot at the top of this page.)
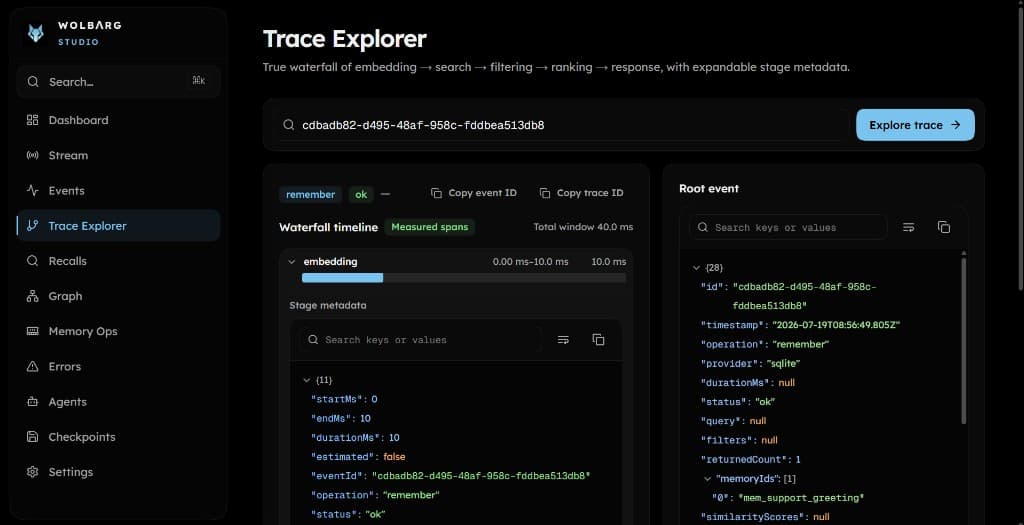
Trace Explorer
True waterfall of embedding → search → filtering → ranking → response, with expandable stage metadata and the root event JSON.
What Studio shows
| Surface | Purpose |
|---|---|
| Dashboard | Live stats and charts |
| Stream | Live SSE event tail |
| Events | Filterable operation stream (dedupe created / updated badges) |
| Trace Explorer | Waterfall + stage metadata |
| Recalls | Scores, timings, explain panels |
| Memory Ops | Per-operation breakdowns |
| Errors | Failed operations for triage |
| Agents | Per-agent activity |
| Checkpoints | List and compare snapshots |
| Connect / Settings | Wire telemetry, memory, checkpoints |
Studio may still show historical or visual graph views from older workflows; those are Studio UI surfaces, not SDK graph APIs (graph memory was removed in 0.6.0).
Notes
- Studio opens SQLite read-only — it never writes to your telemetry or memory databases
- Live mode polls on a configurable interval (default 2s)
- Postgres telemetry connections are represented in config but not implemented yet